
The Preprocessing Barrier in LLMs: Quantifying CPU Bottlenecks in High-Throughput Inference

In the modern AI stack, the GPU is the protagonist. We optimize CUDA kernels, obsess over HBM bandwidth, and debate quantization formats. We often treat the CPU as a mere scheduling clerk—a low-stakes component whose only job is to hand tensors to the GPU.
But in high-throughput production environments, this assumption is becoming a liability. Recent profiling of large-scale inference systems reveals that CPU-bound tasks—specifically preprocessing—can become the primary bottleneck, leaving expensive H100s idling between steps.
This post investigates the Preprocessing Pipeline: the sequence of operations that must occur before a single float hits the GPU. Through a series of benchmarks on a 12-core CPU (Apple M3 Pro), I quantify exactly how the industry-standard Preprocessing stack interacts with concurrency to throttle inference throughput.
The “Hidden” Pipeline
Before an LLM can perform inference, raw text must be transformed into a tensor. This pipeline consists of three distinct stages. It is not just sending text to a model; it is a three-stage CPU pipeline.
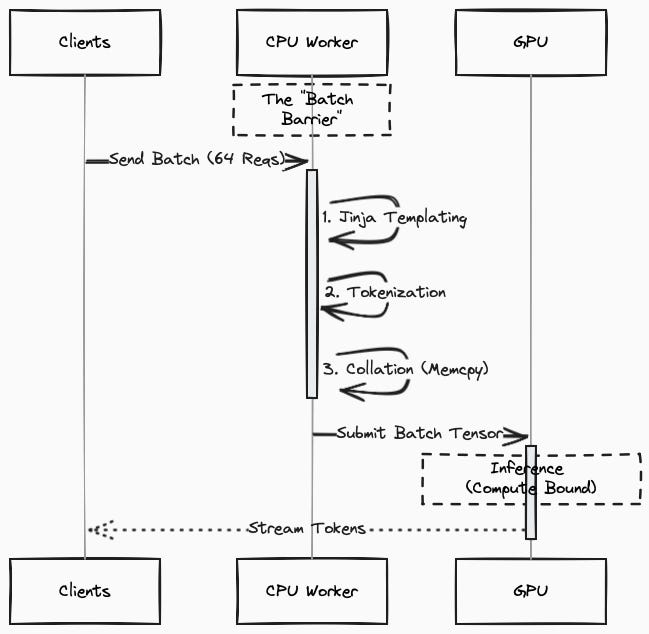
Templating: The server receives a list of JSON messages and compiles them into a single string using a model-specific format (e.g., ChatML).
Implementation: typicallyJinja2(Python).Input [ {”role”: “system”, “content”: “You are a helpful assistant.”}, {”role”: “user”, “content”: “What is 2+2?”} ]Output<|begin_of_text|><|start_header_id|>system<|end_header_id|>You are a helpful assistant.<|eot_id|><|start_header_id|>user<|end_header_id|> What is 2+2?<|eot_id|><|start_header_id|>assistant<|end_header_id|>Tokenization: This string is encoded into integer Token IDs.
Implementation: typicallyHuggingFace Tokenizers or OpenAI tiktoken(Rust backend).Input <|begin_of_text|><|start_header_id|>system<|end_header_id|>... Output [128000, 128006, 9125, 128007, 271, 2675, 527, 264, 11190, 18328, 13, 128009, 128006, 882, 128007, 271, 3923, 374, 220, 10, 16, 30, 128009, 128006, 78191, 128007, 271]
Collation: Integers are converted into PyTorch tensors, padded to matching lengths, and pinned for transfer.
Implementation:PyTorch(Python/C++).Input [ [128000, ... 10, 16, 30], # Request A (Short) [128000, ... 99, 12, 11, ... 88] # Request B (Long) ] Output tensor([ [128000, ..., 10, 16, 30, 128001, 128001], # <--- Padded with EOS ID [128000, ..., 99, 12, 11, ..., 88] ])
The Single Request Baseline Scenario
In Experiment1 (GitHub), I established a baseline by profiling a single Llama-3.1-8B-Instruct request (~1,000 tokens).
Results:
Tokenization (Rust): 0.82 ms (68%)
Collation (PyTorch): 0.30 ms (25%)
Templating (Jinja): 0.08 ms (7%)
Total: ~1.2 ms
Takeaway: For a single request, the overhead is negligible. The Rust-based tokenizer does the heavy lifting efficiently. This leads many teams to conclude: “Preprocessing is fast enough.”
Scaling the single request with history
Real-world usage is rarely single-turn. It involves RAG contexts, multi-turn agent loops, and complex system prompts.
In Experiment 2 (GitHub), I tested how the structure of data impacts performance. I kept the total token count constant (~100k tokens) but varied the number of “turns” (message exchanges) to see if processing 100 short messages is computationally different from processing 1 long message.
Results (100k tokens constant):
| Turns      | Jinja Latency | Tokenization Latency | Scaling Factor |
|------------|---------------|----------------------|----------------|
| 1 Turn     | 0.07 ms       | 56.5 ms              | 1x             |
| 100 Turns  | 0.37 ms       | 58.7 ms              | ~5x Slower     |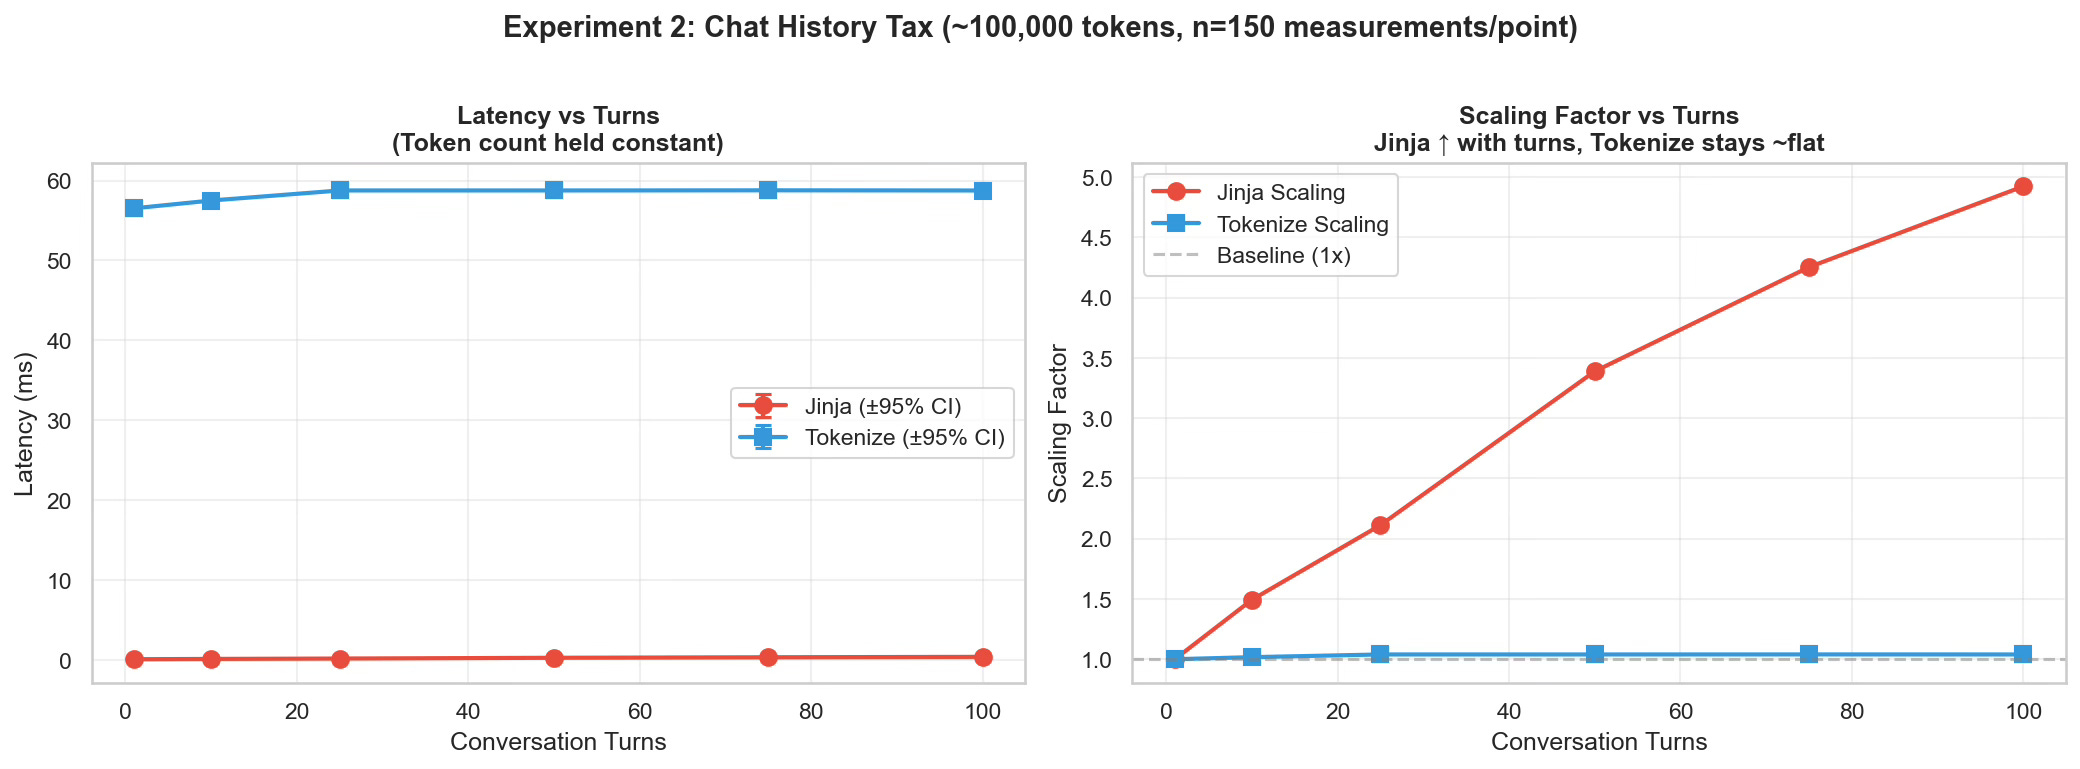
The Insight: Tokenization cost scales with content (tokens). However, Templating cost scales with structure (messages). As your application grows more complex, the Python-based templating layer begins to compound, scaling linearly with complexity while the Rust layer remains stable.
The Production Scenario
The real bottleneck reveals itself in production. Inference servers don’t process requests one by one; they process batches (e.g., 64, 128, or 256 requests) to saturate the GPU’s massive memory bandwidth.
In Experiment 3 (GitHub), I simulated a high-throughput server processing 100,000 requests in batches of 64. I measured “GPU Wait Time”—the wall-clock time the GPU sits idle while the CPU prepares a batch.
I tested this across different thread counts (1 to 64) to see if throwing more CPU cores at the problem would solve it.
| Threads    | GPU Wait Time (Total) | Tokenize Component | Jinja Component |
|------------|-----------------------|--------------------|-----------------|
| 1 Thread   | 456 ms                | 409 ms             | 18.6 ms         |
| 64 Threads | 134 ms                | 83 ms              | 22.3 ms         |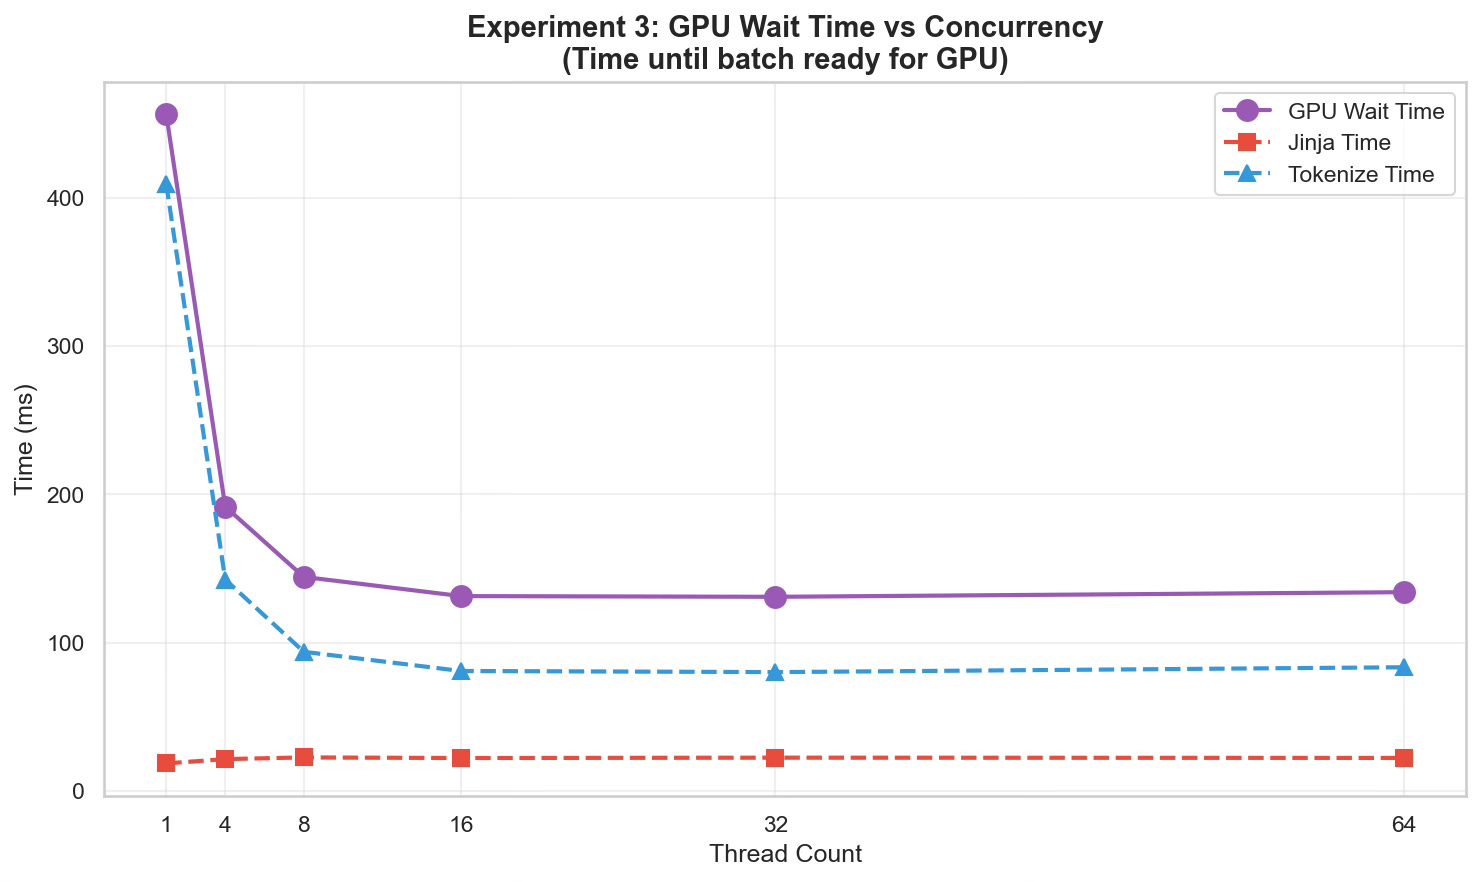
The Bottleneck Shift: As we increased concurrency, the Rust-based tokenization scaled beautifully, speeding up by ~5x(409ms → 83ms) by utilizing available cores.
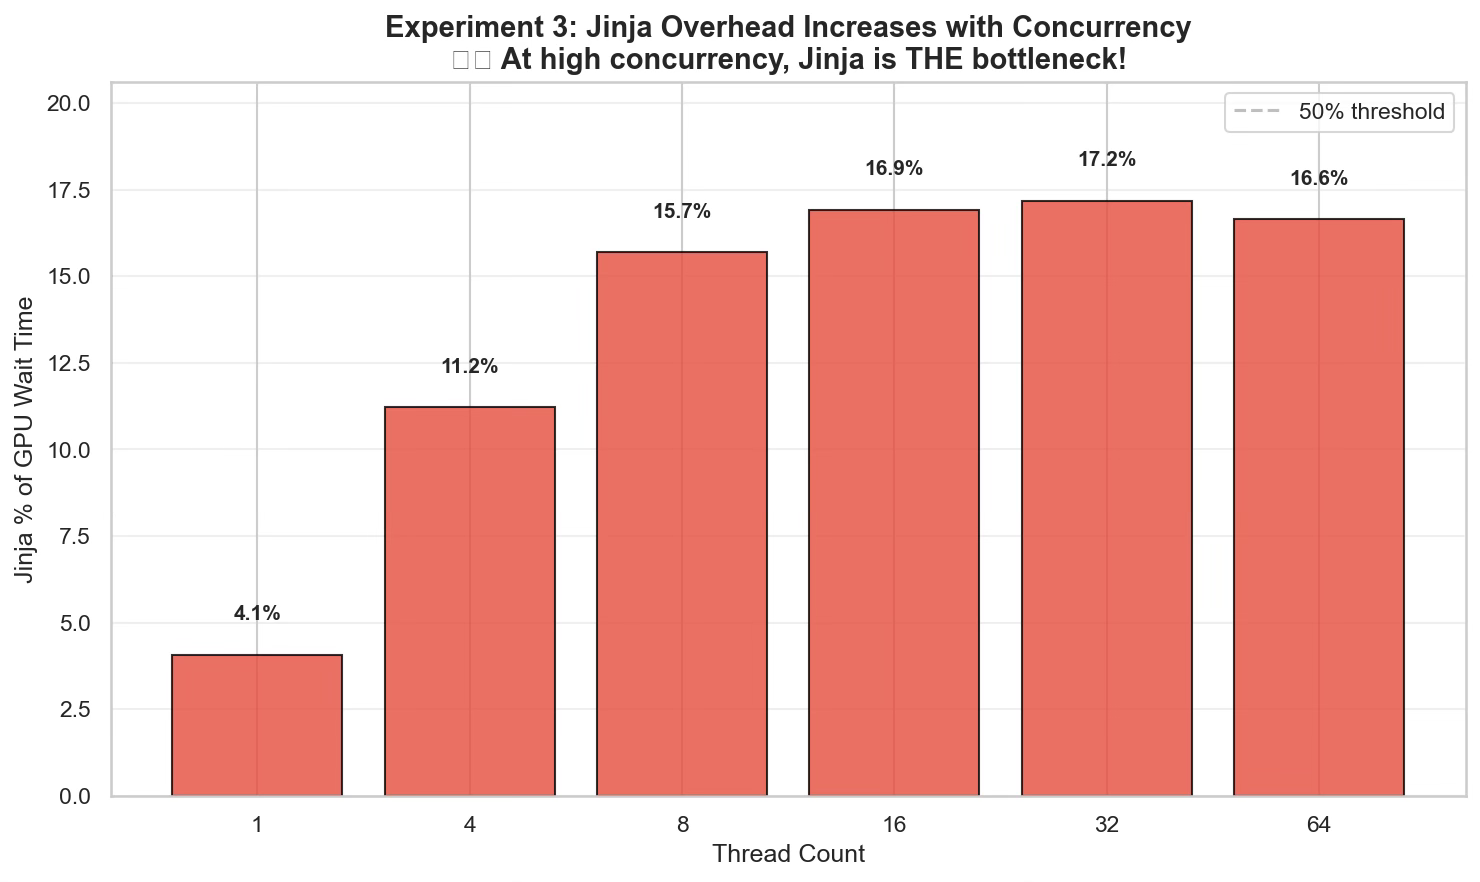
However, the Jinja templating component actually got slower (18ms → 22ms).
At 64 threads, the “trivial” Jinja templating accounted for 16.6% of the total time the GPU spent waiting. In a system processing thousands of requests per second, this 22ms per batch is a hard ceiling on throughput that no amount of GPU optimization can fix.
The scaling limitations of templating
In Experiment 4 (GitHub), I ran a detailed profiling benchmark to measure the Speedup Factor (ideal linear scaling) of each component as thread counts increased.
The Results (32 Threads):
Tokenization (Rust): 5.72x Speedup. The Rust backend releases the GIL, allowing true parallel execution on multiple cores.
Templating (Python): 0.84x Speedup. It got slower than a single thread.
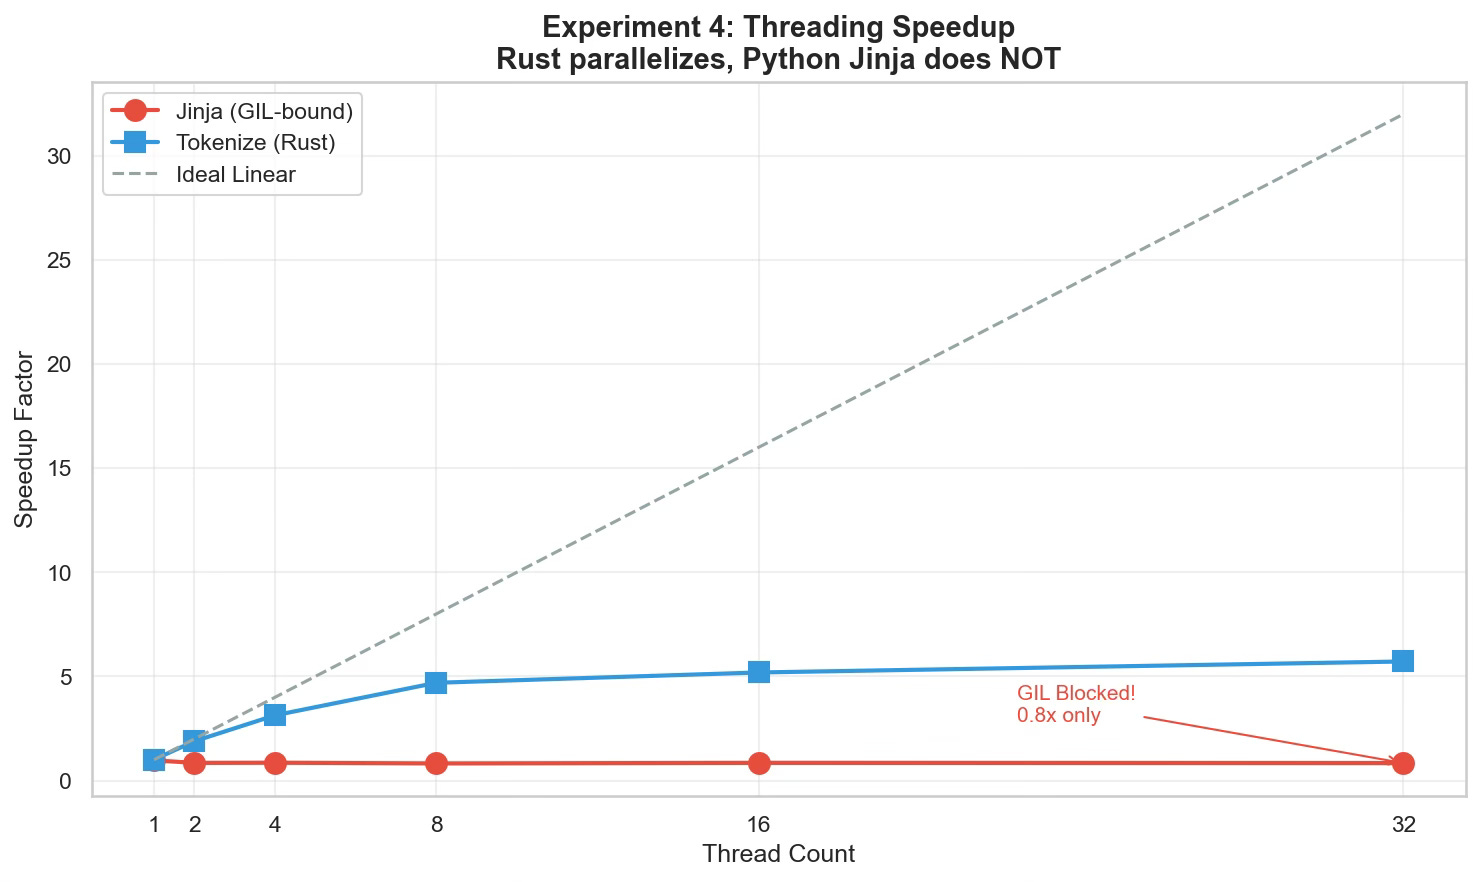
The Diagnosis: This is the Global Interpreter Lock (GIL) in action. Because Jinja2 is a pure Python library, only onethread can execute templating logic at a time. When we launched 64 threads, they didn’t run in parallel; they fought for the same lock, adding context-switching overhead.
In a naive Python-based serving setup, your 12-core CPU is effectively a single-core machine for the templating phase.
Conclusion: A Systems Approach to Inference
Our benchmarks quantify a critical lesson for AI Systems: We cannot optimize inference by only looking at the GPU. CPU Preprocessing is not "free," and your code concurrency has limits.
Do Not Ignore the CPU: If your GPU utilization is hovering at 60-70%, do not assume it is a model architecture issue. Check your preprocessing latency. The GPU might simply be starving for tensors.
Focus on All Components: Optimizing tokenizers (via Rust) was a massive win for the community, but as we moved to chat models, Templating (Jinja) has emerged as the new bottleneck.
Ensure Full CPU Utilization: Having 12 cores is useless if your code is GIL-bound to one. You must ensure your serving infrastructure uses patterns (like Multiprocessing or C++ backends) that can actually saturate those cores.
What’s Next? Identifying the bottleneck is step one. In the next post, we will explore Production Architectures that solve this:
vLLM’s Async Engine: How it manages the event loop to minimize blocking.
SGLang: How “Radix Attention” caches preprocessing work to skip this step entirely for shared history.
The Sidecar Pattern: Decoupling the CPU heavy-lifting from the GPU worker entirely.
Code Availability: The benchmarking suite used for this analysis is available at Github